#BTC Price

Strategy Buys Another $1 Billion in Bitcoin, Holdings Cross 780,000 BTC

Michael Saylor is not slowing down. Strategy disclosed on Monday that it bought another 13,927 BTC last week, spending roughly $1 billion at an average price of $71,902 per coin. The purchase brings total holdings to 780,897 BTC, acquired for a cumulative $59.02 billion at an average cost basis of $75,577.
The announcement came just hours after Saylor posted his now-familiar "Think Bigger" message on X alongside the company's orange-dot BTC purchase history chart. For anyone who has followed Strategy closely, the post was less of a hint and more of a countdown. He has used the same signal before every major acquisition since 2020, and this time was no different.
Strategy raised $1 billion through sales of its STRC preferred stock product, known internally as Stretch, to finance the buy entirely. The STRC instrument requires only about a 2.05% annual Bitcoin return to cover its dividend obligations. In other words, as long as Bitcoin does not flatline or fall steadily for years on end, the math works in Saylor's favor, at least in theory.
Still, the numbers are not exactly comfortable right now. Strategy disclosed $14.46 billion in unrealized losses on its digital assets for the first quarter of 2026 in a recent SEC filing. With Bitcoin trading near $71,000 and the company's average cost sitting above $75,500, the bulk of its position remains underwater. Saylor has not blinked. He declared earlier this month that "Bitcoin has won" and that the traditional four-year halving cycle is essentially dead, replaced by a market now driven primarily by institutional capital flows.
The scale of Strategy's accumulation in 2026 is hard to ignore. The company added 89,599 BTC year-to-date through late March, compared to roughly 8,484 BTC for BlackRock's IBIT over the same period. That pace puts Strategy more than 7x ahead of the world's largest asset manager in terms of 2026 Bitcoin accumulation. The gap between the two largest holders has narrowed to around 20,000 BTC, and at the current rate, Strategy could overtake IBIT as the single largest holder before summer.
To put the buying pace another way: in March alone, Strategy accumulated 46,233 BTC while the entire global Bitcoin mining network produced approximately 16,200 BTC. A single company absorbed nearly three times the newly minted supply in a single month. That kind of pressure should, theoretically, move markets. But it has not, at least not consistently.
The question of why Strategy's purchases fail to push the price higher has become something of a standing puzzle in crypto markets. CoinDesk analysts pointed to a few reasons: Strategy accounts for only about 7% of gross inflows into Bitcoin, meaning its purchases are still relatively small against the total market. More importantly, capital has been leaving the ecosystem. Bitcoin's realized cap saw a $29 billion drawdown since February, and BlackRock's IBIT open interest dropped over $4 billion in the same window. Those outflows have largely swamped the buying pressure Strategy generates.
U.S.-listed spot Bitcoin ETFs did manage $1.32 billion in net inflows during March, ending four consecutive months of outflows. But price action stayed flat for the month regardless, reinforcing the point that the link between inflows and price is neither direct nor immediate. Saylor's confident framing of Bitcoin as a new form of permanent institutional capital may be accurate in the long run. Whether it holds up in 2026's choppy macro environment, with geopolitical tensions running high and BTC sitting below his average cost, remains a much harder question to answer.
With 780,897 BTC now on its books, Strategy controls approximately 3.7% of Bitcoin's total circulating supply of about 20 million coins. MSTR shares were down roughly 2.5% in pre-market trading on Monday following the disclosure. The stock has become a proxy for leveraged Bitcoin exposure and tends to amplify both the upside and the pain. At the current pace, Strategy could push past 800,000 BTC before the end of April. Saylor, it seems, is just getting started.

Crypto Markets Drop as Trump Threatens to Hit Iran 'Extremely Hard'

Whatever optimism had crept back into crypto markets over the past two days got wiped out Thursday morning after President Trump's primetime address to the nation offered not a path to peace, but a harder line. Crypto fell. Stocks fell. Oil surged past $106. The familiar cycle repeated itself, for roughly the fifth or sixth time in five weeks.
Bitcoin dropped 3% to around $66,000, giving back the gains it had quietly built on Tuesday. Ethereum fell by a similar margin, sliding to $2,056. BNB shed 4.9% to $580, XRP lost 3.5% to $1.30, and Solana's SOL had the worst session of the major tokens, off 5.2% and now down roughly 13% on the week. It was an ugly morning across the board, and it felt awfully familiar.
A Rally Built on Hope, Not Reality
Tuesday had been, briefly, a good day. Trump had made offhand comments suggesting the Iran conflict could wrap up within weeks and that a formal deal was not necessarily a prerequisite for a resolution. That was enough. Asian equities surged 4%. S&P 500 futures climbed. Bitcoin pushed back toward $69,000. The crypto Fear and Greed Index, which had been pinned at single digits for weeks, got a bit of air.
Then came the Wednesday speech. In nearly 20 minutes, Trump outlined no real shift in Iran policy, offered no pathway to a ceasefire, and gave no timeline for reopening the Strait of Hormuz, the critical oil shipping lane that has been effectively closed since mid-March. He said the strait would reopen 'naturally' once hostilities subside. That was not what markets had priced in and our small rally just went away.
The Real Problem Underneath the Headlines
Analysts and traders increasingly point out that tracking Trump's daily commentary on Iran may be beside the point. The underlying oil market situation has been quietly deteriorating, independent of whatever the president says on any given afternoon. The International Energy Agency's member nations authorized the largest coordinated strategic petroleum reserve release in the organization's 50-year history, around 426 million barrels in total, to compensate for the near-shutdown of Hormuz flows. Those flows represent about 20% of the world's seaborne oil trade.
The problem is that those emergency reserves are expected to run dry within weeks. When that happens, the manageable shortfall of roughly 4.5 to 5 million barrels per day could balloon to 10 or 11 million, which would be an entirely different kind of crisis. Ship insurance premiums for Hormuz transits remain elevated. Tanker traffic through the strait has not recovered. The real-world picture, independent of political statements, is not improving.
Going Nowhere Fast
Bitcoin has essentially traded between $60,000 and $73,000 for the entirety of the conflict, now entering its sixth week. It sells off on escalation headlines, bounces on de-escalation headlines, and ends up more or less where it started. The Fear and Greed Index has been stuck between 8 and 14 for a month, deep in extreme fear territory. The pattern has become almost mechanical at this point.
There are some who see reasons for cautious optimism, and they are not entirely without basis. April has historically been one of Bitcoin's stronger months, finishing green in 10 out of 15 years with an average gain of around 20.9%. Bitcoin also bounced clearly off two-month uptrend support near $60,000 last week and is attempting to reclaim its 50-day moving average. Spot Bitcoin ETFs have seen roughly $2.5 billion in net inflows over the past month, a sign that institutional interest has not collapsed. BlackRock noted this week that large investors are concentrating specifically in Bitcoin and Ether rather than spreading into the broader altcoin market.
But seasonality does not trade against a war. Until the conflict itself shows signs of genuinely unwinding, the pattern of hope, headline, reversal is unlikely to change. Wednesday was just another reminder of that.
The next few weeks will likely be decisive, not because of anything Trump says, but because of what happens with oil supply fundamentals that have been quietly building toward a breaking point regardless of the diplomatic noise.

Bitcoin Rally Builds Ahead of $14B Options Expiry

Bitcoin climbed back toward the $72,000 mark Wednesday as the derivatives market showed telltale signs of growing leverage, putting traders on alert for sharp moves in either direction. The world's largest cryptocurrency rose roughly 1.2% after midnight UTC, mirroring gains across U.S. equity futures, with the Nasdaq 100 up around 1% over the same window. BTC was last seen trading near $71,300, well within the choppy $69,000 to $76,000 band that has defined the market for much of March.
The session's gains carried a cautionary undertone. Futures open interest in bitcoin has climbed to a one-week high, driven in large part by short positioning rather than fresh bullish conviction. Traders who have seen BTC get turned away from $72,000 repeatedly appear to be leaning into those rejections rather than chasing a breakout. Funding rates and cumulative volume delta have stayed flat to muted, two readings that analysts typically cite when the OI build is defensive in nature rather than a signal of aggressive dip-buying.
$14 Billion Options Expiry Looms Large
The backdrop sharpens considerably when you factor in what is sitting on the calendar for Friday. Deribit, the dominant crypto options venue, is set to settle roughly $14.16 billion in bitcoin contracts at 08:00 UTC on March 27, a figure that accounts for nearly 40% of all open interest on the exchange. The quarterly event is the single largest derivatives settlement of Q1 2026, and it arrives with a specific price level commanding outsized attention.
That level is $75,000. According to Deribit, max pain for this Friday's expiry sits right there, meaning it is the price at which the highest number of contracts expire worthless and option writers, typically large funds and institutional players, would owe the least. Deribit Chief Commercial Officer Jean-David Pequignot described the dynamic as a gravitational pull, noting that delta-hedging activity by market makers historically nudges spot prices toward that pain threshold in the hours leading up to settlement.
The gap between where bitcoin is trading now and $75,000 is not trivial, a roughly 5% move from current levels. Whether max pain theory ultimately delivers on that gravitational pull remains a matter of debate even inside the industry. But with nearly 40% of Deribit's open interest scheduled to roll off in one session, the mechanical hedging flows alone are worth watching closely.
Altcoins Showing Stronger Positioning
While Bitcoin grinds sideways with mounting leverage, a more constructive picture is forming in parts of the altcoin market. Ethereum open interest has climbed to multi-month highs, and the positioning profile looks more directionally bullish than what is currently visible in BTC futures. DeFi-adjacent tokens and AI infrastructure projects are outperforming Bitcoin on a short-term basis, with the CoinDesk Computing Select Index, which tracks TAO, FET, and Chainlink, rising about 1.9% Wednesday to lead all major benchmarks.
Chainlink alone accounts for roughly 62% of that index and added 1.5% on the day, while TAO and FET posted gains of 4.9% and 2.9% respectively. The broader CoinDesk 20 benchmark gained around 0.9%, with the altcoin-heavy CoinDesk 80 generally outpacing the bitcoin-heavy CoinDesk 5. The pattern suggests that risk appetite has not evaporated, it is simply migrating toward names where there is clearer near-term narrative momentum.
A Market Trapped Between Catalysts
Zoom out and the picture gets harder to trade comfortably. Bitcoin is on pace to close March in the red, which would extend a losing or flat monthly streak to six consecutive months, the longest such run since the 2022 bear market. The final week of the month carries several potential catalysts, including the U.S. Personal Consumption Expenditures data on March 28, which could shift rate-cut expectations and send ripples through risk assets.
For now, the market appears to be threading a needle between a derivatives setup that could pull prices higher ahead of Friday and a macro backdrop that has not yet given bulls a clean reason to push through resistance with conviction. Rising open interest without corresponding spot demand and funding is historically the kind of configuration that resolves violently, though the direction is rarely obvious until it starts moving. With $14 billion in contracts settling in roughly 48 hours, the next few sessions aren't looking to be very quiet.
Bitcoin Climbs Past $71,000 as Trump Claims Iran Ceasefire

Bitcoin surged to $71,200 on Monday as investors are optimisitc on de-escalation of the Iran conflict.
The move started when President Trump posted on Truth Social that he had instructed the Department of War to postpone planned strikes against Iranian power plants and energy infrastructure for five days, following what he called "very good and productive" talks with Tehran. Crypto jumped roughly 5% on the news. Ether climbed above $2,100, BNB pushed through $650, and XRP traded above $1.40. Oil plunged around 11%, S&P 500 futures gained nearly 4%, and global markets added an estimated $2.5 trillion in value within about 20 minutes.
Then Iran's state-affiliated Fars News Agency cited an unidentified source denying any talks had taken place. Gains started reversing almost immediately. Bitcoin is now up about 2.5% on the day and down roughly 5% on the week, sitting just under $71,000 after hitting an intraday high of $71,224 per CoinGecko data.
The session is the latest chapter in a conflict that has rattled crypto markets since Operation Epic Fury launched on February 28, when the U.S. and Israel struck targets across Iran and killed Supreme Leader Ali Khamenei. Iran's subsequent blockade of the Strait of Hormuz, a critical chokepoint for global oil flows, has kept energy prices elevated and risk appetite suppressed. The Federal Reserve, meeting earlier this month against that backdrop, revised its 2026 inflation forecast upward to 2.7% and signaled a higher-for-longer stance on rates.
Despite the chaos, Bitcoin has held above its pre-war price level, a fact that has not gone unnoticed. When the strikes began on a Saturday morning and every traditional market was closed, crypto was the only liquid venue available for investors to respond. That 24/7 trading reality, once seen as a volatility risk, has started looking more like a feature.
The five-day pause, if it holds at all, does not end the conflict. Iran continues to strike targets across the Gulf, and Israel would need to sign on to any broader ceasefire. Israel has publicly said it has thousands of remaining targets and requires at least three more weeks of operations. Prediction markets currently favor a ceasefire by late April at the earliest.
Bitcoin's 30-day implied volatility index has bounced to 60%, and $791 million in total leveraged positions have been wiped across crypto markets this session according to CoinGlass, with $425 million of those being longs. The clock on Trump's five-day window is ticking, and so is the market's patience.

Dormant Bitcoin Wallet Moves After 13 Years
A Bitcoin wallet holding 2,100 BTC (worth over $147 million) became active after more than 13 years of dormancy.
The wallet, identified by the address 1NB3ZXx…BQB6ZX, moved 0.00079 BTC (approximately $55.71) at 11:27 a.m. UTC on Friday, a tiny fraction of its total holdings. According to data from Bitinfocharts, the wallet received the 2,100 BTC in a single transaction on July 4, 2012.
At the time, Bitcoin was trading at $6.59, valuing the holdings at about $13,839. The wallet’s value has since increased by more than 10,000x, rising to over $147 million today.

Image credit: Bitinfocharts
This move did not go unnoticed in the crypto community, with many applauding the whale’s patience and others calling it one of the most effective trading strategies.
“13.7 years of silence… just to move $56. That’s not a sell signal — it’s a reminder of what conviction looks like in Bitcoin. From $6 to $75,000, the biggest returns didn’t come from trading… they came from time,” said Andy Wang, CEO of crypto platform HashWhale.
This isn’t the first Bitcoin whale wallet to be reactivated this year. In January, a 13-year-old dormant wallet moved 909 BTC, worth about $85 million, to a new address.
About a week ago, another Bitcoin whale that had been dormant for roughly two years transferred 343 BTC, worth approximately $23.85 million, between Binance and Cobo.
Bitcoin’s Price Action This Month
Despite experiencing significant volatility this month, Bitcoin has posted a net positive month-to-date gain.
Starting the month at around $67,000, Bitcoin dipped to $65,303 before surging to $74,000 days later, and was trading at $69,927 as of March 10. It also reached a peak of $75,988, with some analysts speculating about a potential breakout above $80,000.
According to data from CoinMarketCap, Bitcoin is currently trading at around $69,807, with a 24-hour trading volume of approximately $39 billion and a market capitalization of nearly $1.396 trillion.
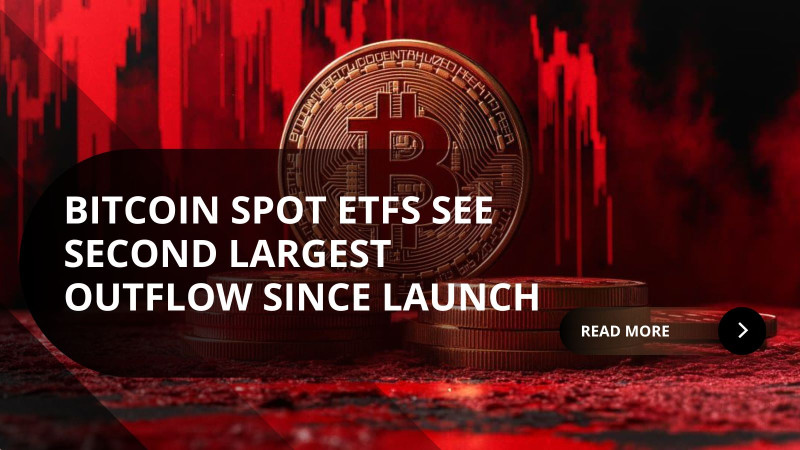
Bitcoin Drops Below $95K as Spot ETFs Log Second-Largest Outflows Ever
Bitcoin Drops Below 95,000 Dollars as Spot ETFs Log Second-Largest Outflows Ever
Bitcoin’s slide below 95,000 dollars comes at the same moment U.S. spot Bitcoin ETFs are seeing their second-largest weekly outflows on record, creating a powerful combination of macro pressure, profit-taking, and structural selling.
This is what is actually happening across markets.
Bitcoin breaks below 95,000 dollars as risk appetite evaporates
Bitcoin has been drifting lower for weeks, but the latest leg down reflects broader stress across global risk markets.
-
BTC recently hit a six-month low, trading near 95,800 dollars, down roughly 24 percent from its all-time high above 126,000 dollars earlier in the fall.
-
A sharp selloff in major tech stocks has spilled into crypto. Falling prices in high-beta names like Tesla and Nvidia dragged the Nasdaq lower, and Bitcoin is moving in correlation.
-
On several trading venues, Bitcoin briefly dipped under the 95,000 dollar level, shaken by fading expectations for a near-term Federal Reserve rate cut.
Macro sentiment is driving it. The Fed has signaled caution, and higher yields make cash and bonds more attractive relative to volatile assets like crypto. Risk capital is stepping back accordingly.
Spot Bitcoin ETFs suffer second-largest outflows since launch
At the same time Bitcoin’s price is weakening, spot Bitcoin ETFs are hemorrhaging capital.
Recent ETF flow data shows:
-
About 1.23 billion dollars in net outflows over a single week, marking the second-largest weekly outflow since spot Bitcoin ETFs launched in early 2024.
-
This reversal comes immediately after a massive 2.7 billion dollar inflow the previous week, showing how rapidly sentiment flipped.
Other analytics platforms confirm the scale:
-
More than 2 billion dollars has exited spot Bitcoin ETFs over a similar seven-day stretch.
-
These outflows were led by major products, including the largest U.S. Bitcoin ETFs.
Put simply, the same ETF vehicles that fueled Bitcoin’s run above 120,000 dollars are now feeding selling pressure.
Why ETF investors are selling
1. Profit taking after a euphoric rally
Bitcoin surged to record highs earlier in the fall. Much of that momentum was driven by strong ETF inflows and speculative leverage. When the rally stalled, ETF holders began locking in gains.
In the past month, sustained inflows flipped into a multi-day streak of heavy outflows totaling more than 2 billion dollars.
2. Macro risk-off environment
The ETF redemptions are unfolding during a broader derisking period.
-
Tech stocks are sliding.
-
Investors are reducing exposure to volatility.
-
Falling expectations for Federal Reserve rate cuts are punishing non-yielding assets.
When institutions derisk, ETFs offer an easy way to trim exposure quickly and in size.
3. Long-term holders are selling, too
On-chain estimates show that long-term BTC holders sold roughly 815,000 BTC over the last month. That is the largest 30-day selling wave by long-term holders in close to a year.
When long-term holders sell while ETFs see redemptions, structural and tactical selling pressures align.
Are ETF outflows causing the price drop?
ETF outflows and price declines are interconnected, but not in a simple cause-and-effect way.
-
When ETFs see inflows, issuers buy Bitcoin on the open market.
-
When ETFs see redemptions, they release or sell Bitcoin, which can weigh on price.
But flows also respond to price, rather than only drive it.
During recent drawdowns, Bitcoin began falling before the biggest ETF outflow prints hit. Markets weakened first, flows followed, and the selling then reinforced the downturn.
The bigger picture is not entirely bearish
Despite the heavy redemptions, ETF-held Bitcoin remains historically large.
-
U.S. spot Bitcoin ETFs still hold well over 130 billion dollars in assets even after the latest outflows.
-
These ETFs still control a significant percentage of the circulating BTC supply.
This means institutions have not abandoned Bitcoin. They are rebalancing, not exiting.
What traders and investors should take away
Short-term traders
Expect higher volatility.
Key levels like 95,000, 90,000 and 85,000 dollars will become focal points for liquidations, panic selling, and sharp reversals.
ETF flow data will continue to be a powerful short-term signal. Large outflows can become self-reinforcing sell triggers.
Long-term investors
This environment looks more like a mid-cycle reset than the end of the trend.
-
ETF holdings remain massive.
-
Institutional allocators are still active.
-
Periods of heavy outflow historically set up longer-term opportunities for patient buyers.
What to watch next
-
Daily spot ETF flows
Look for stabilization or the return of small net inflows. Historically, that has coincided with market bottoms. -
Federal Reserve tone
Rate expectations continue to drive risk appetite. -
On-chain behavior
Whether long-term holders continue selling or begin accumulating again will play a crucial role. -
Equity market sentiment
As long as Bitcoin behaves like a high-beta tech asset, weakness in equities will spill into crypto.
Final thoughts
Bitcoin’s break below 95,000 dollars paired with the second-largest weekly outflow ever recorded in spot Bitcoin ETFs shows that the market is finally cooling after an overheated rally. ETF redemptions and long-term holder selling are contributing to the pressure, but they are unfolding within a broader global derisking trend.
The ETF era has not failed. If anything, this volatility highlights how deeply Bitcoin has become integrated into mainstream portfolios, where selling flows can move quickly in response to macro signals.
For traders, this phase demands discipline. For long-term believers, it is a reminder that institutional adoption does not eliminate corrections. It simply changes their shape and scale.
Stay Connected
You can stay up to date on all News, Events, and Marketing of Rare Network, including Rare Evo: America’s Premier Blockchain Conference, happening July 28th-31st, 2026 at The ARIA Resort & Casino, by following our socials on X, LinkedIn, and YouTube.